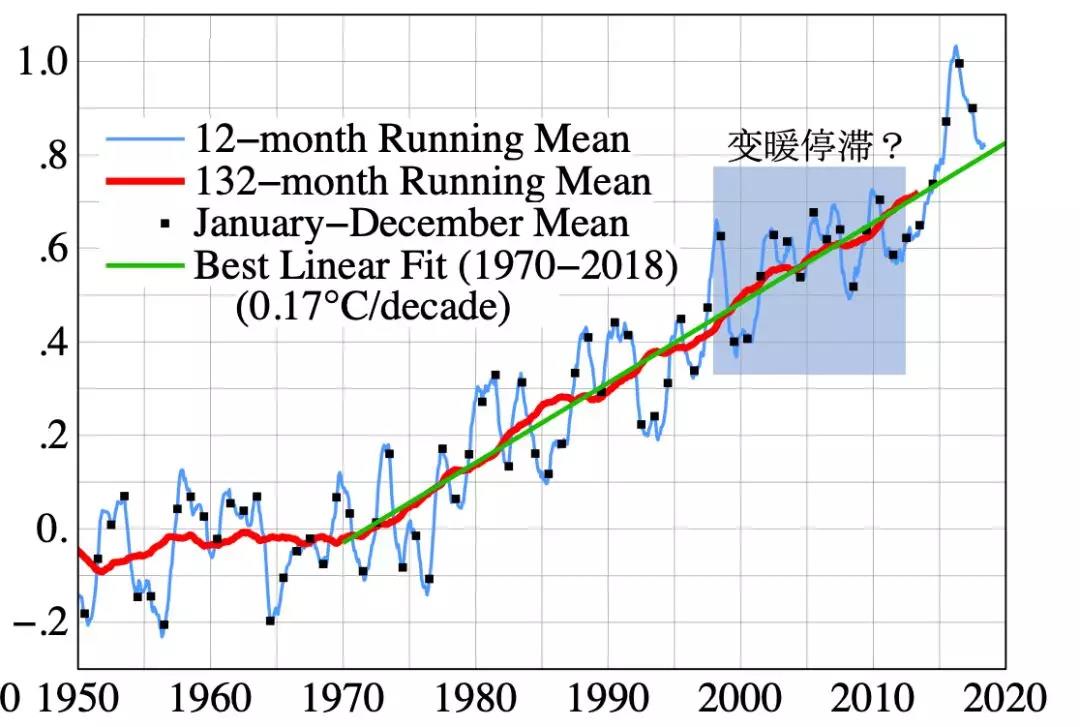
图8. 自1880年以来的全球地表温度序列,资料表明在1998-2012年之间确实存在温度增幅不明显的阶段,这即是所谓的“全球变暖停滞”(Hiatus)。数据来自于https://data.giss.nasa.gov/gistemp/(2018年12月17日版本)
然而随着2013年之后温度重新飙升,尤其是2015-2016的超强厄尔尼诺引起全球温度飙升,使得1998年的高温记录迅速掉到了10名以后,全球变暖停滞的概念一下子似乎成了“明日黄花”。但是全球表面气温资料中显示的“停滞”是如何形成的?确实还是需要更合理的科学解释。

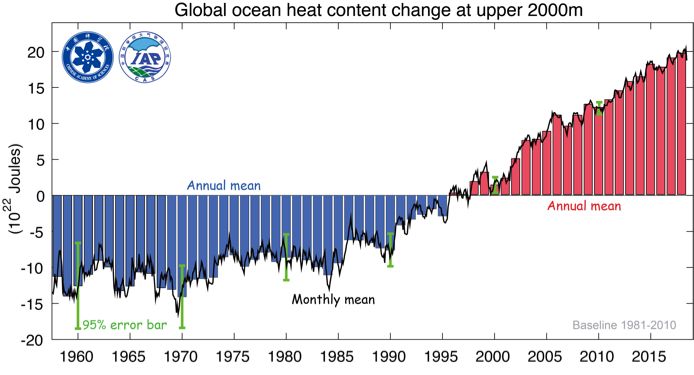
图9. 从1958年到2017年的全球海洋热容量变化。图片来自于Cheng et al. (2018)
如果利用全球海洋热含量的数据来回看过去50年的气候变化,可以发现,海洋热含量序列里根本就没有变暖停滞期,其变化表现出稳定的增长趋势(图7和图9)。这说明如果要考察地球的气候变化,需要将大气与海洋一起综合考虑,考虑到海洋的巨大面积、巨大热容量,海洋热容量比地表面温度序列更能准确的反映过去几十年里到底发生了什么样的气候变化。因为全球温室气体增加引起的全球增暖,其热量分配与流动在整个气候系统里进行,近期地表/海表温度变化的“停滞”,仅仅是海气相互作用的自然变率的产物,是由于海洋能量在不同深度间的输送导致的,全球变暖并未停滞。当综合考察海-气系统的变化之后,“全球变暖停滞”(Hiatus)基本上就成为伪命题了。
参考文献
[1]Abraham J. P., Baringer M., Bindoff N. L., et al. 2013: A review of global ocean temperature observations: Implications for ocean heat content estimates and climate change. Rev. Geophys., 51: 450-483.
[2]Cheng L., J. Abraham, G. Goni, et al., 2016: XBT Science: assessment of instrumental biases and errors, Bulletin of the American Meteorological Society, 97, 924-933.
[3]Cheng L., K. Trenberth, J. Fasullo, et al. 2017: Improved estimates of ocean heat content from 1960 to 2015, Science Advances. 3,e1601545c.
[4]Cheng L. and J. Zhu, 2016, Benefits of CMIP5 multimodel ensemble in reconstructing historical ocean subsurface temperature variation, Journal of Climate, 29(15), 5393–5416, doi: 10.1175/JCLI-D-15-0730.1.
[5]Cheng L. et al. 2019: 2018 Continues Record Global Ocean Warming, Advances in Atmospheric Science, 36(3), 249-252, Doi: 10.1007/s00376-019-8276-x.
[6]Cheng, L., J. Abraham, Z. Hausfather, K. E. Trenberth, 2019: How fast are the oceans warming? Observational records of ocean heat content show that ocean warming is accelerating, Science, 363, 6423. doi: 10.1126/science.aav7619.


